Autocorrelation
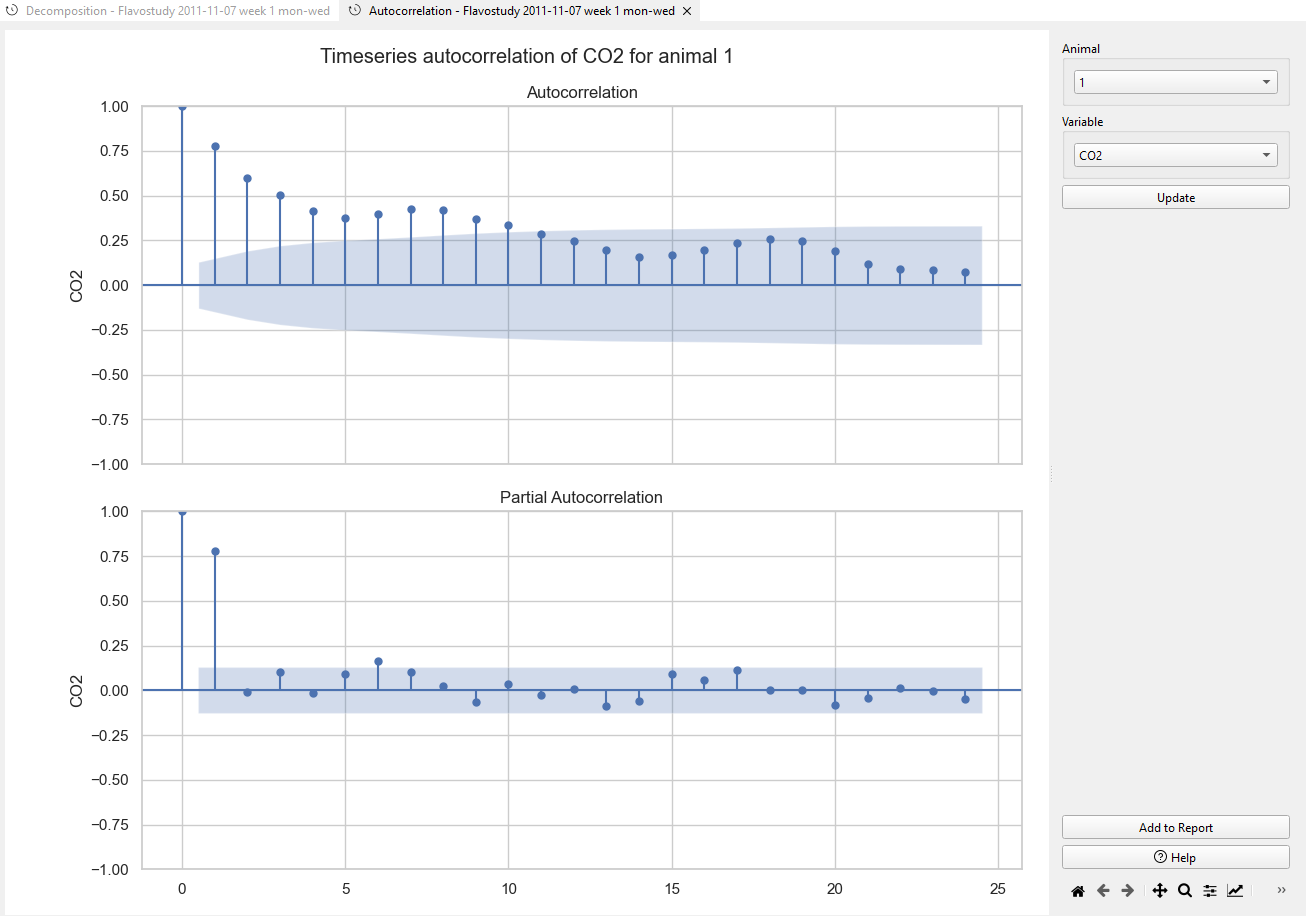
Time series autocorrelation refers to the correlation of a time series with its own past values. It measures the degree of similarity between a time series and a lagged version of itself over successive time intervals. Autocorrelation is a key concept in time series analysis as it helps in identifying patterns and dependencies in the data.
Note
The y-axis shows the correlation values, ranging from -1 to +1, representing the strength and direction of the relationship between the data points. A value close to +1 indicates a strong positive correlation, while a value near -1 indicates a strong negative correlation. The lag values are automatically calculated by the software code and cannot be adjusted by the user.
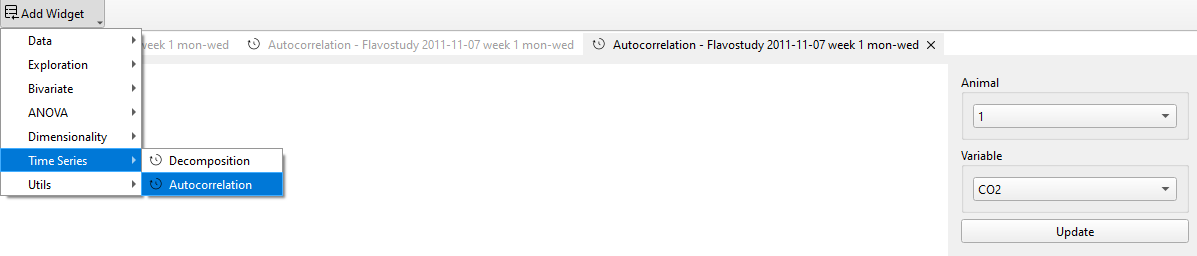
Clicking Update in the control panel is necessary to display time series plots or to apply changes in the analysis settings to the plots.
The plot appearance can be edited by using the tools available in the plot menu at the bottom of the control panel.
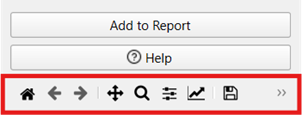
From left to right: - Home button (‘House’): Reset the orientation of the plot in its frame. - Undo/Redo (‘Arrows’ left/right): Undo and redo actions regarding the orientation of the graph in its frame (moving and zooming). - Pan (‘Arrow cross’): Grab and move the graph within the frame of the plot. - Zoom (‘Magnifying glass’): Select an area of the plot to zoom in/ enlarge the selected area. - Subplots (‘Slider bars’): Adjust the dimensions of frame borders and spacings between graphs. - Customize (‘Graph’): - Define title, axis range, label and scale, and legend. - Adjust style, size and color of curves. - Save (‘Memory disc’): Save image on the hard drive.
Note
Any changes in graph appearance made through the plot menu are applied immediately, without clicking Update.
Time series plots can be exported via the Save button (‘Memory disk’ symbol) in the plot menu at the bottom of the control panel or added to the report by clicking Add to Report.