One-way ANOVA
One-way ANOVA tests whether groups defined by a single factor differ significantly by partitioning variance into between-group and within-group components.
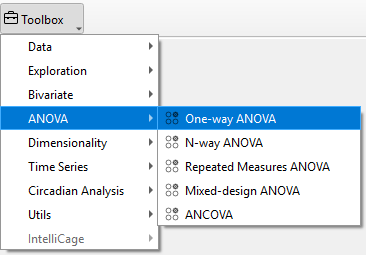
To perform one-way ANOVA in TSE Analytics, select the respective data set from the Toolbox and choose One-way ANOVA. Select one factor from the Factors list and choose a variable from the Dependent Variable list. If needed, adjust the Effect size type via the dropdown menu. Click Update to calculate analysis results.
Analysis result tables for one-way ANOVA include:
Univariate normality test for normal distribution:
- W: Test statistic
- pval: p-value
- normal: True, if data is normally distributed / False if data is not normally distributed
Homoscedasticity (equality of variances)
- W: Test statistic
- pval: p-value
- equal_var: True, if data has equal variance / False, if data has unequal variance
In case of equal variances (equal_var = True):
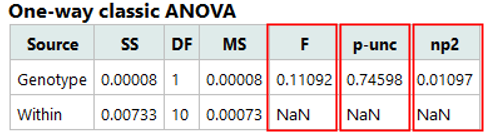
One-way classic ANOVA
- Source: Factor names
- SS: Sums of squares
- DF: Degrees of freedom
- MS: Mean squares
- F: F-values
- p-unc: uncorrected p-values
- np2: Partial eta-square effect sizes
Pairwise Tukey-HSD post-hoc test
- A: Name of first measurement
- B: Name of second measurement
- mean(A): Mean of first measurement
- mean(B): Mean of second measurement
- diff: Mean difference (= mean(A) - mean(B))
- se: Standard error
- T: T-values
- p-tukey: Tukey-HSD corrected p-values
- effect size type: Effect size as defined in “Effect size type” dropdown menu
If equality of variances is not given (equal_var = False):
One-way Welch ANOVA
- Source: Factor names
- ddof1: Numerator degrees of freedom
- ddof2: Denominator degrees of freedom
- F: F-values
- p-unc: Uncorrected p-values
- np2: Partial eta-squared effect sizes
Pairwise Games-Howell post-hoc test
- A: Name of first measurement
- B: Name of second measurement
- mean(A): Mean of first measurement
- mean(B): Mean of second measurement
- diff: Mean difference (= mean(A) - mean(B))
- se: Standard error
- T: T-values
- df: Adjusted degrees of freedom
- pval: Games-Howell corrected p-values
- effect size type: Effect size as defined in “Effect size type” dropdown menu
Multiple comparisons plot
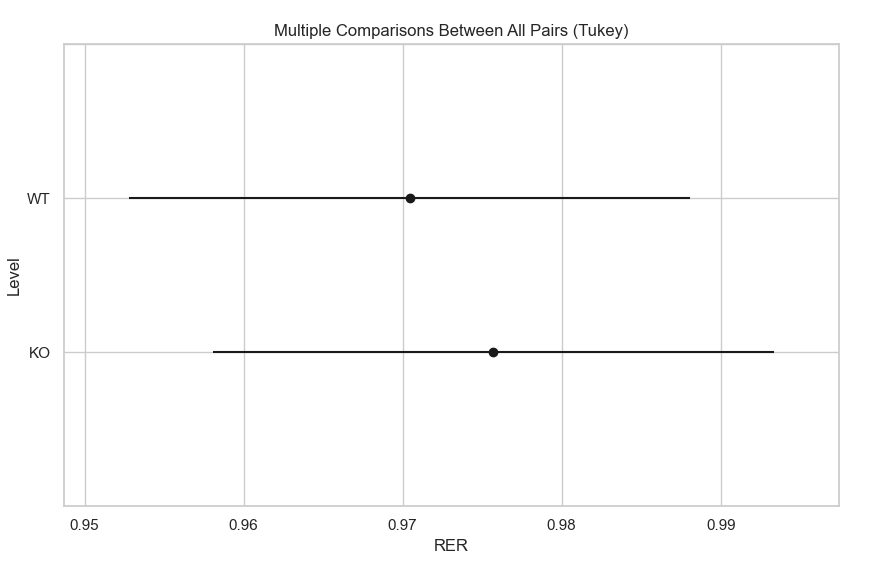
The multiple comparisons plot generated for one-way ANOVAs allows to graphically identify significant pairwise comparisons based on the Tukey HSD (Honestly Significant Difference) test statistic for multiple comparisons. The plot shows the means (dot) and confidence intervals (horizontal lines) of the selected variable for each factor group. Confidence intervals are calculated based on the respective Tukey’s q critical value, which is dependent on the confidence level, degrees of freedom and the number of groups. A statistically significant difference between two groups is given, if the respective confidence intervals do not overlap.
Note
Graphical representation of confidence intervals is always based on the Tukey HSD test, independent of the pairwise comparison method applied to post-hoc test tables (Tukey HSD for one-way classic ANOVA and Games-Howell for one-way Welch ANOVA).
Example Interpretation
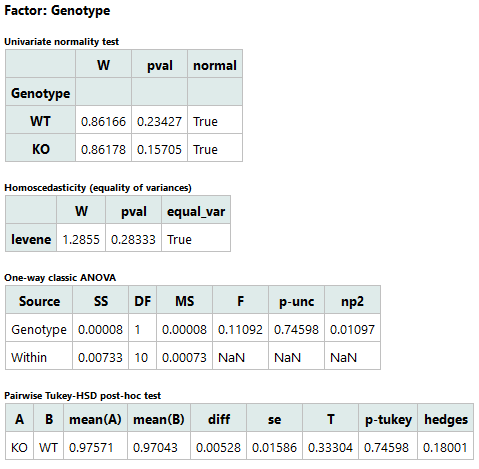
Based on the example dataset analyzed above, in an animal behavior experiment, RER (respiratory exchange ratio) was measured to compare different genotypes (Genotype), with groups WT (wild-type) and KO (knockout).
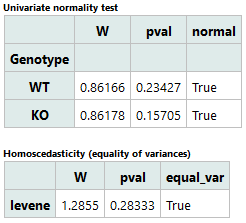
1. Before interpreting the ANOVA results, ensure that the data meet the analysis assumptions (normality and homoscedasticity):
-
Both WT (p = 0.234) and KO (p = 0.157) have p-values greater than 0.05, indicating that their data are approximately normally distributed.
-
The Levene test examines whether the group variances are equal. The test shows p = 0.283 (> 0.05), meaning that the variances between WT and KO are not significantly different.
2. Once the assumptions are satisfied, the One-way ANOVA results can be examined:
-
The ANOVA table compares the variance between groups (Genotype) and within groups (individual differences).
-
The F statistic (0.11092) is very small, and the p-value (0.746) is much greater than 0.05, indicating that the difference in RER between WT and KO is not statistically significant. The effect size (η² = 0.011) is also very small, suggesting that genotype explains only a minimal proportion of total variance.
3. If ANOVA shows no significant difference, a post-hoc test (e.g., Tukey) can be performed to confirm that group differences remain non-significant.
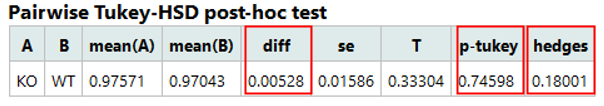
- The Tukey post-hoc test confirms that the difference between WT and KO remains non-significant (p = 0.746). The mean difference (0.005) is negligible, and the small effect size (Hedges g = 0.18) further supports that the groups behave similarly in RER.
In this example, WT and KO exhibit very similar RER values. Therefore, the difference between the groups is not statistically significant, and genotype exerts minimal effect on the outcome.