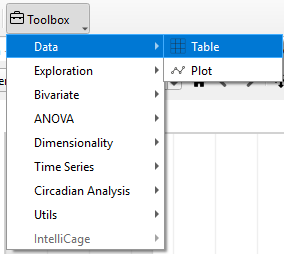
Table
The Table widget shows all metadata as well as selected variables data for all animals selected in the Animal widget under consideration of Time binning and Outlier settings as well as the selected Split Mode.
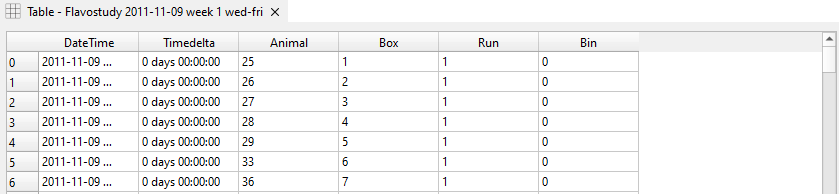
- DateTime: Date and time of data collection
Note
DateTime is not included in Table for merged data files using the merging mode ‘Overlap’
- Timedelta: Time difference between the start of an experiment at the time of data collection
- Animal: Name of an animal as specified in the PhenoMaster file or Animal widget.
Note
Only data of animals selected in the Animal widget will be displayed in Table.
- Box: Box(cage) number as indicated in the PhenoMaster file and Animal widget.
- Run: Run number. For individual datasets, the default value is “1”. For merged dataset (merged as multiple runs), each dataset is assigned a run number according to their merging order (i.e. their chronological order).
- Bin: Time bin number. Data with the same ‘DateTime’ stamp, i.e. data collected at the same time (‘Timedelta’ for merged datasets using ‘Overlap’) is assigned the same time bin, according to their chronological order. If time binning is applied, time intervals, light/ dark cycles or time phases are used as time bins.
- Factors: Factors and assignment of animals to groups as specified in the Factors widget.
Data can be sorted by a variable by clicking on the respective variable in the table header. The order of data entries (low to high vs high to low) can be changed by clicking the respective variable header again. By default, data is sorted by 'DateTime'.
The column width can automatically be adjusted by clicking Resize Columns in the control panel.
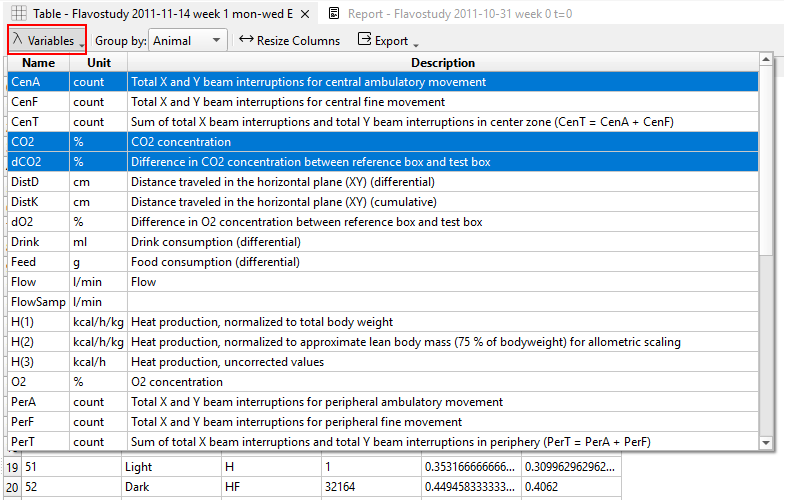
One or multiple variables to be displayed in the data table can be selected from the Variables selector in the control panel of the Table widget (selected variables highlighted in blue).
Data of each time bin is grouped according to the Split Mode selected in the control panel: - Total: The mean of all data entries for each bin is calculated. - Animal: Data is displayed for each animal individually, i.e. without grouping (default). - Run: The mean of all data entries assigned to the same run is calculated for each bin.
Note
Split modes “Total” and “Run” produce the same results if only one individual dataset (i.e. one run) is analyzed. In case of merged datasets (not merged as a single run), this split mode allows calculating means of the individual datasets (i.e. individual runs) used for merging.
- Factor: The mean of all animals assigned to the same factor group is calculated for each bin. The factor considered for grouping has to be selected from the Factor dropdown menu.
For each selected variable, descriptive statistics including the count of values (count), mean, standard deviation (std), minimum and maximum are displayed in a separate window under Descriptive Statistics in the control panel. Descriptives can be added to the report by clicking Add to Report at the bottom of the control panel.
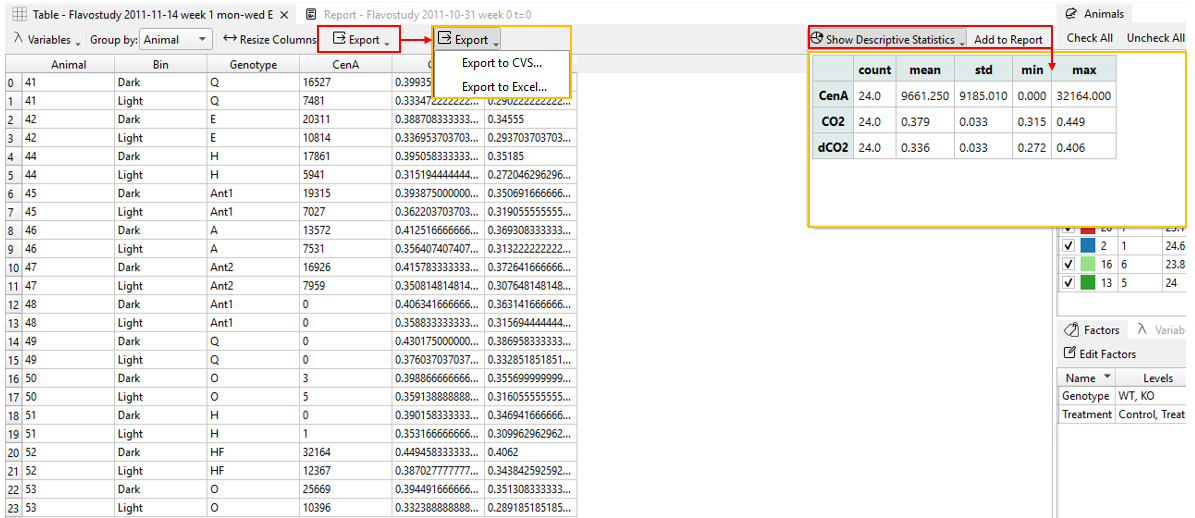
Data table entries as displayed in the Table widget can be exported as Excel or text (CSV) files via Export - Export to CSV or Export to Excel.
Warning
Grouping of data using split modes will not affect the exported data table, but only the data displayed within the software. The exported data table will always contain all variables exported from PhenoMaster independent of variable selection in the Table widget.