PCA
Principal Component Analysis (PCA) is a statistical technique used in data analysis and machine learning for dimensionality reduction while preserving as much variation as possible.
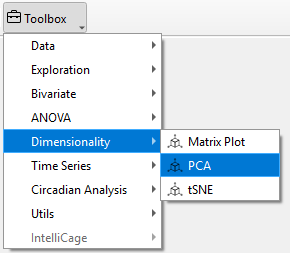
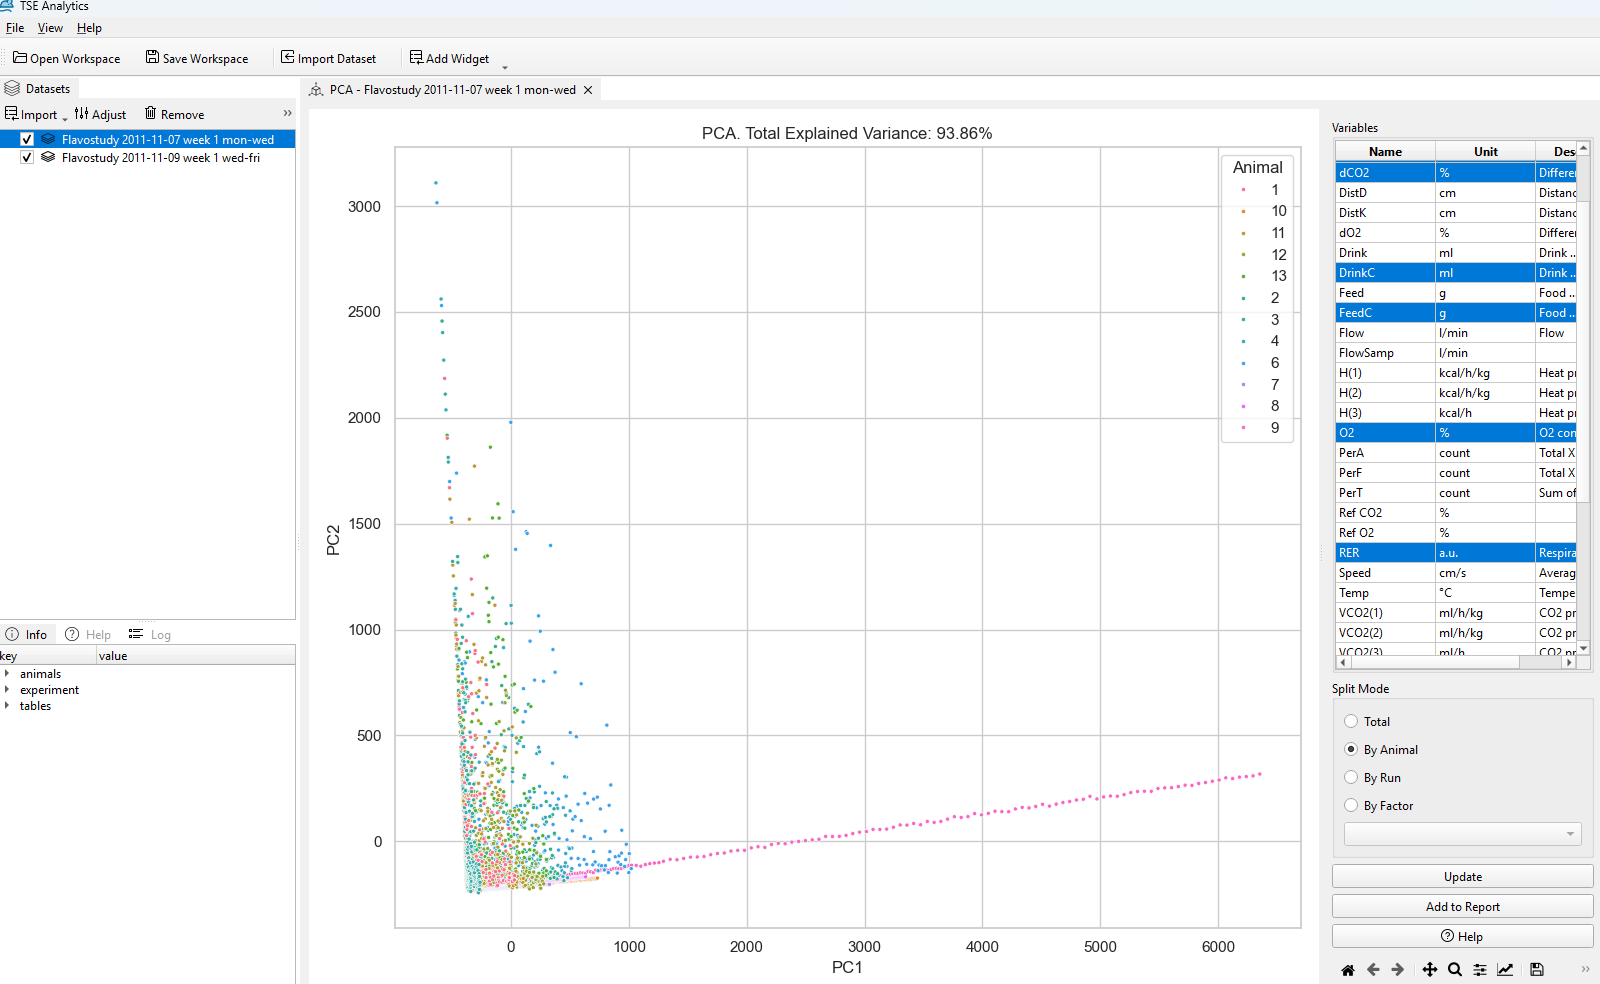
To perform a Matrix Plot in TSE Analytics, go to Add Widget | Dimensionality | PCA. First, select the dataset you want to analyze from the left side of the interface. Then, in the Variables list on the right, choose at least two variables to explore their pairwise relationships. Users can specify the analysis dimension in the Split Mode section.Click Update to apply the PCA and generate the results
PCA Analysis
-
Explained Variance Ratio: This indicates the proportion of the dataset's variance captured by each component. Higher values mean the component captures more of the dataset's structure.The total variance shown as example figure is 93.86%, which is quite high. This means that these two components capture most of the variability in your data.
-
Principal Components(PC): The resulting plot will show the principal components, which are the directions in which the data varies the most.
The x-axis (PC1) represents the first principal, which captures the largest amount of variation in the data. It represents the main trend or pattern that differentiates animals in your dataset based on the selected variables.
The y-axis (PC2) represents the second principal,which captures the second most significant variation, which explains additional differences that weren't captured by PC1. -
Visualizing Patterns: By reducing the data dimensions, you can visualize clusters or trends in your data that were not obvious in the original higher-dimensional space. For example, animals that are further apart on the plot differ more in the underlying variables, while animals closer together are more similar.

Warning
Using fewer variables may limit the ability to capture meaningful patterns in the data. Therefore, please ensure that at least three or more variables need to be chosen for the PCA analysis when using software.