Exploration
Exploration allows researchers to visually inspect data distributions, identify outliers, and assess normality before formal statistical analysis, guiding appropriate analysis choices.
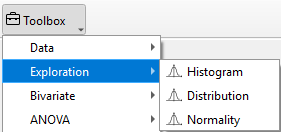
TSE Analytics offers multiple graphical tools to perform exploratory analysis in the Exploration widget, including histograms, violin- and box plots, as well as normal probability plots. Plots can be generated using different modes (total, by animal, by factor) under consideration of time binning settings and outlier detection settings.
Warning
Only animals selected in the Animal list are considered for the calculation and display of plots in the Exploration widget. Changes regarding the selection of animals are only applied after clicking Update.
All plot settings can be adjusted using the control panel of the Exploration widget.
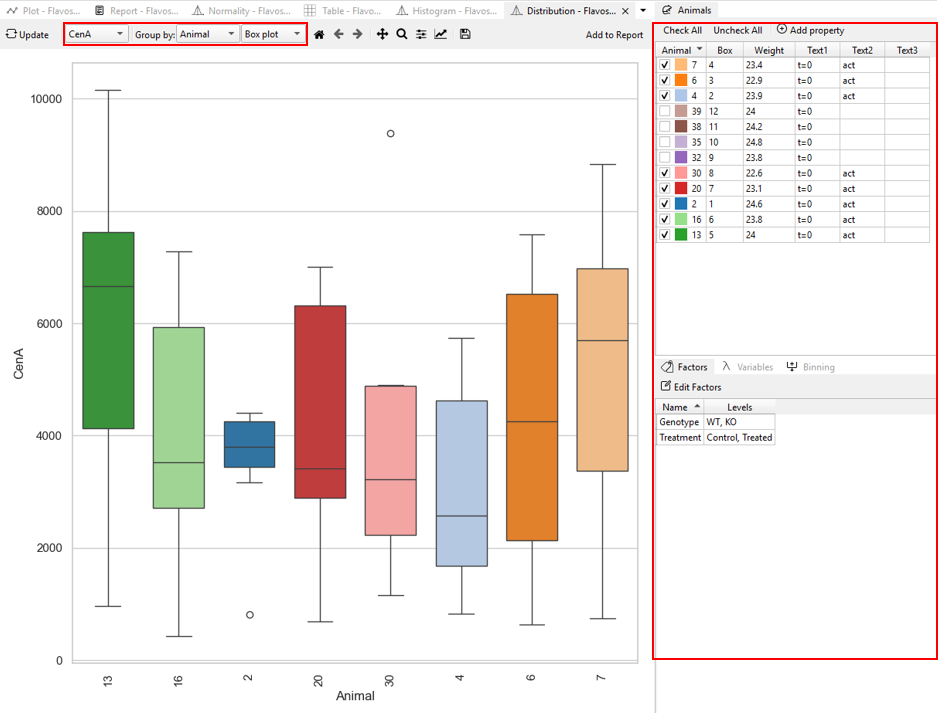
The respective variable to be plotted can be selected from the Variable drop-down menu on the top. The type of plot (Histogram, Distribution, Normality) can be chosen under Exploration. If the plot type Distribution has been selected, two plot options are available: violin and boxplot.
After selecting a variable, different groups can be chosen for analysis. - By Total: All data entries for the respective variable are considered for plotting. - By Animal: A plot for each animal is generated individually. - By Factor: A plot for each group of the selected factor is generated. The corresponding factor setting is located at the bottom-right of the software interface.
Note
To show plots and to apply any changes of settings to the plots displayed, click Update in the control panel (graphs won’t update automatically).
To further customize the appearance of the generated plot, use the Plot Menu located above the graph. For detailed instructions, refer to the section “Customize the Appearance of the Result” in the “Toolbox Widgets” chapter.
The displayed graphs can be saved together in the current active workspace for further editing or export by clicking Add to Report. For detailed instructions, refer to the section “Editing and Exporting Analysis Results (Via Report)” in the “Getting Started – Data Export” chapter.