Repeated Measures ANOVA
Repeated measures ANOVA is used to identify significant differences between the means of groups with the same subjects, for example for repeated measurements in the same animals at different time points.
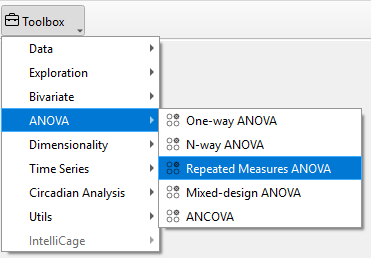
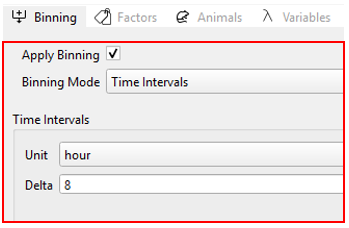
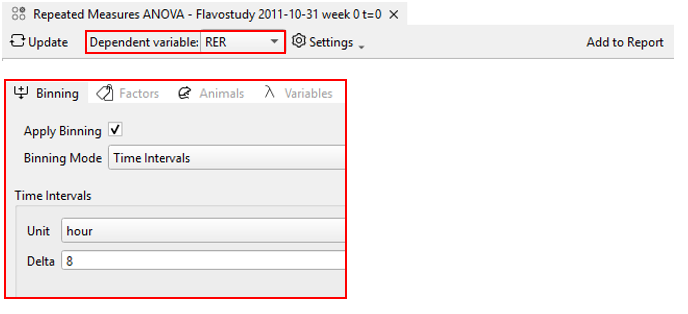
To perform repeated measures ANOVA using the within-subject factor “time bin” without additional between-subject factors, select the respective data set from the Toolbox and choose Repeated measures ANOVA. Apply (Time) Binning using the binning mode which defines the repeated measures, i.e. bins, and choose a variable from the Dependent Variable list. If needed, select a P-values adjustment method or adjust the Effect size type via the dropdown menu. Click Update to calculate analysis results and apply changes in the analysis settings.
Note
Repeated measures ANOVA is only performed if Time Binning is applied.
Analysis result tables for repeated measures ANOVA include:
Sphericity test:
- Sphericity: True, if data has the sphericity property.
- W: Test statistic
- Chi-square: Chi-square statistic
- DOF: Degrees of freedom
- p-value: p-value
*Repeated measures one-way ANOVA:
- Source: Name of the within-subject factor (“Bin”) or Error
- SS: Sums of squares
- DF: Degrees of freedom
- MS: Mean squares
- F: F-value
- p-unc: Uncorrected p-value
- p-GG-corr: Greenhouse-Geisser corrected p-value
- ng2: Generalized eta-square effect size
- eps: Greenhouse-Geisser epsilon factor (= index of sphericity)
- sphericity: Sphericity of the data (True / False)
- W-spher: Sphericity test statistic
- p-spher: p-value of the sphericity test
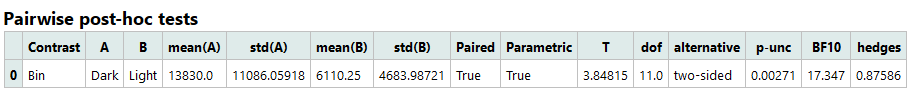
Pairwise post-hoc tests:
- Contrast: Within-subject factor (“Bin”)
- A: Name of first measurement
- B: Name of second measurement
- mean(A): Mean of the second measurement
- std(A): Standard deviation of the second measurement
- mean(B): Mean of the second measurement
- std(B): Standard deviation of the second factor group
- Paired: Indicates whether the two measurements are paired or independent
- Parametric: Indicates if parametric tests were used
- T: T statistic
- dof: Degrees of freedom (only if parametric=True)
- alternative: Tail of the test
- p-unc: Uncorrected p-values
- p-corr: Corrected p-values
- p-adjust: p-values correction method
- BF10: Bayes Factor
- effect size type: Effect size as defined in “Effect size type” dropdown menu
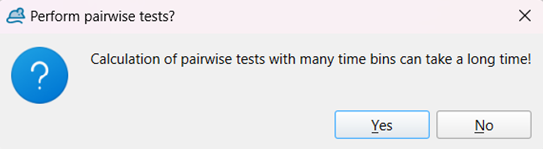
Warning
The time needed to calculate pairwise comparison results for repeated measures ANOVA increases with the number of time bins. In case of binning by time intervals, calculation of ANOVA results might take several minutes depending on the computer’s computing power.
Therefore, when performing repeated measures ANOVA using time binning by time intervals, users can choose whether pairwise comparisons should be performed in a pop-up window.
Example Interpretation
Based on the example dataset analyzed below, in an animal metabolic experiment, the RER (Respiratory Exchange Ratio) was continuously recorded using the PhenoMaster system. Data were processed using the Time Interval binning mode, where each time bin represents an 8-hour interval.
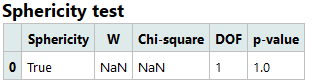
1. Sphericity Test
Before interpreting repeated measures ANOVA, the sphericity assumption must be checked. Sphericity indicates whether the variances of the differences between all pairs of repeated measures (time bins) are equal.
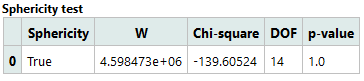
Since the software reports Sphericity = True,p = 1.0 (> 0.05), the data satisfy the sphericity assumption, meaning that the variances of the differences between all pairs of repeated measures (time bins) are approximately equal.
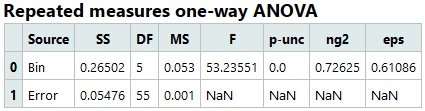
2. Repeated Measures One-way ANOVA
The ANOVA table summarizes variance between time bins (temporal effect) versus within subjects (individual variability).
The F statistic (F = 53.24) is large and the p-value (< 0.001) is highly significant, indicating that RER values differ significantly across time intervals. The effect size (η²g = 0.726) is very large, showing that approximately 73% of the total variance in RER is explained by time-dependent changes. This result strongly suggests a robust temporal pattern in RER across the 8-hour bins.
3. Pairwise Post-hoc Tests
Pairwise post-hoc comparisons identify which specific time bins differ from each other.
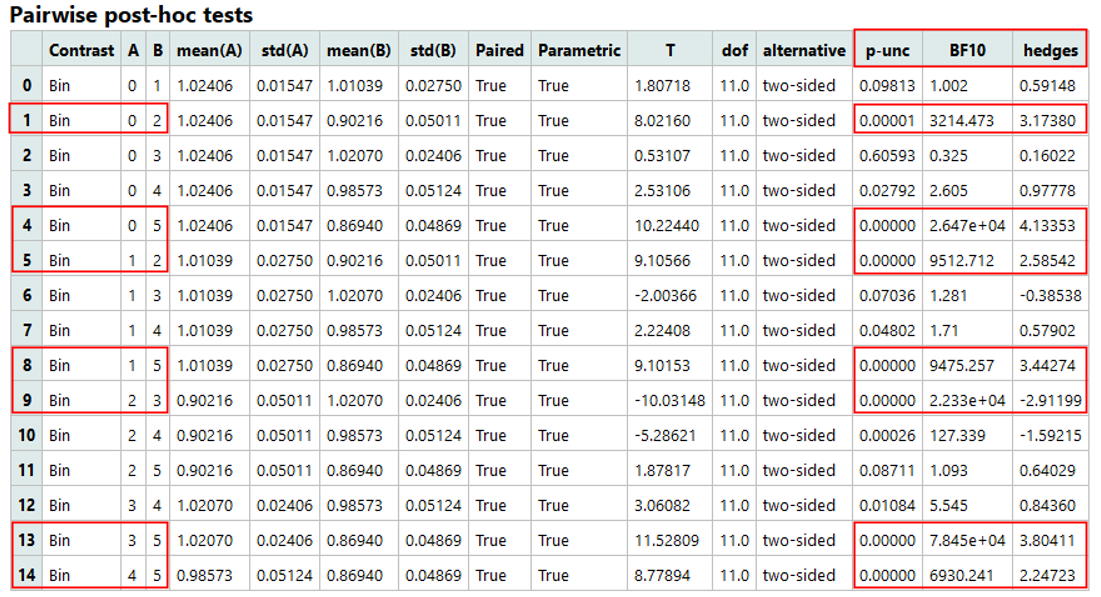
Key results from the table:
-
Several comparisons show highly significant differences (e.g., Bin 0 vs Bin 2: p = 0.00001, Bin 0 vs Bin 5: p = 0.00000).
-
All tests are paired (same animals measured repeatedly).
-
The Hedges g values (e.g., 3.17, 4.13) indicate large effect sizes, supporting strong temporal changes in RER.
-
The Bayes Factors (BF10 > 1000) further confirm strong evidence for differences between certain bins.
From this example, RER values show significant and substantial differences between multiple time intervals, confirming that RER fluctuates dynamically across the day. This pattern may correspond to diurnal metabolic shifts (e.g., higher carbohydrate oxidation during active/dark phases and higher fat oxidation during resting/light phases).