ANCOVA
Analysis of Covariance (ANCOVA) allows testing for statistical differences between two or more groups while at the same time controlling for the effects of covariate variables on the dependent variable, thereby combining ANOVA and regression analysis.
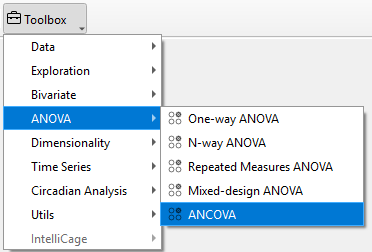
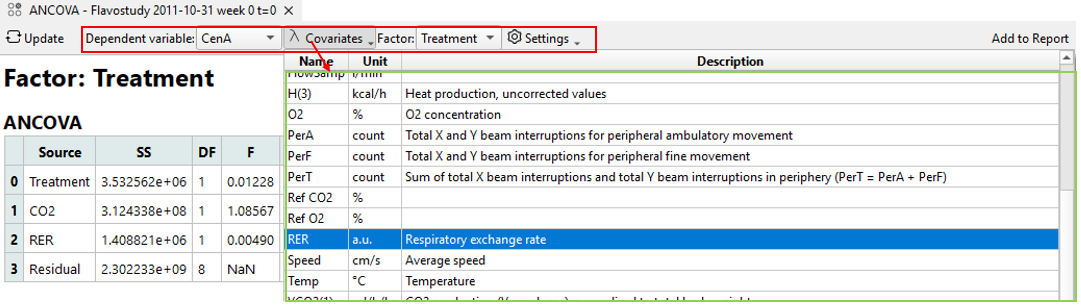
To perform ANCOVA in TSE Analytics, select the respective data set from the Add widget and choose ANCOVA as the analysis Mode in the AN(C)OVA control panel. Select a factor from the Factors list, choose a dependent variable from the Dependent Variable list and select one or multiple covariate variables from the Covariate list (must bot be the dependent variable). If needed, a P-values adjustment method and Effect size type can be selected from the respective dropdown menu. Analysis results are calculated according to the selected settings by clicking Update.
Analysis result tables for ANCOVA include:
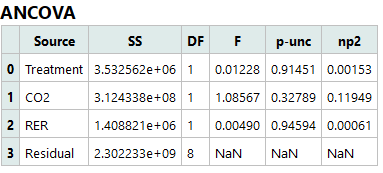
ANCOVA:
- Source: Names of the factors considered
- SS: Sums of squares
- DF: Degrees of freedom
- F: F-values
- p-unc: Uncorrected p-values
- np2: Partial eta-squared
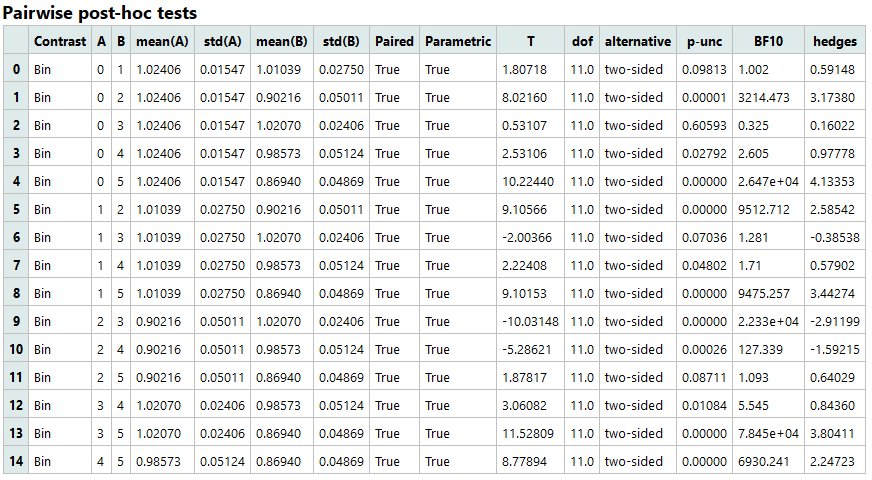
Pairwise post-hoc tests:
- Contrast: Factor (=independent variable)
- A: Name of first measurement
- B: Name of second measurement
- mean(A): Mean of the second measurement
- std(A): Standard deviation of the second measurement
- mean(B): Mean of the second measurement
- std(B): Standard deviation of the second factor group
- Paired: Indicates whether the two measurements are paired or independent
- Parametric: Indicates if parametric tests were used
- T: T statistic
- dof: Degrees of freedom (only if parametric=True)
- alternative: Tail of the test
- p-unc: Uncorrected p-values
- p-corr: Corrected p-values
- p-adjust: p-values correction method
- BF10: Bayes Factor
- effect size type: Effect size as defined in “Effect size type” dropdown menu