t-SNE
t-Distributed Stochastic Neighbor Embedding (t-SNE) is a dimensionality reduction technique specifically designed for visualizing high-dimensional data in a lower-dimensional space (typically 2D or 3D). It is particularly effective for embedding high-dimensional data into a space of two or three dimensions, which can then be visualized in a scatter plot.
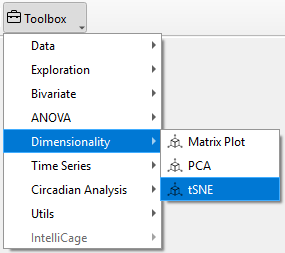
To perform t-SNE in TSE Analytics, go to Add Widget | Dimensionality | tSNE. First, select the dataset you want to analyze from the left side of the interface. Then, in the Variables list on the right, choose at least two variables to explore their pairwise relationships. Users can specify the analysis dimension in the Split Mode section.Click Update to apply the tSNE and generate the results
t-SNE Analysis
-
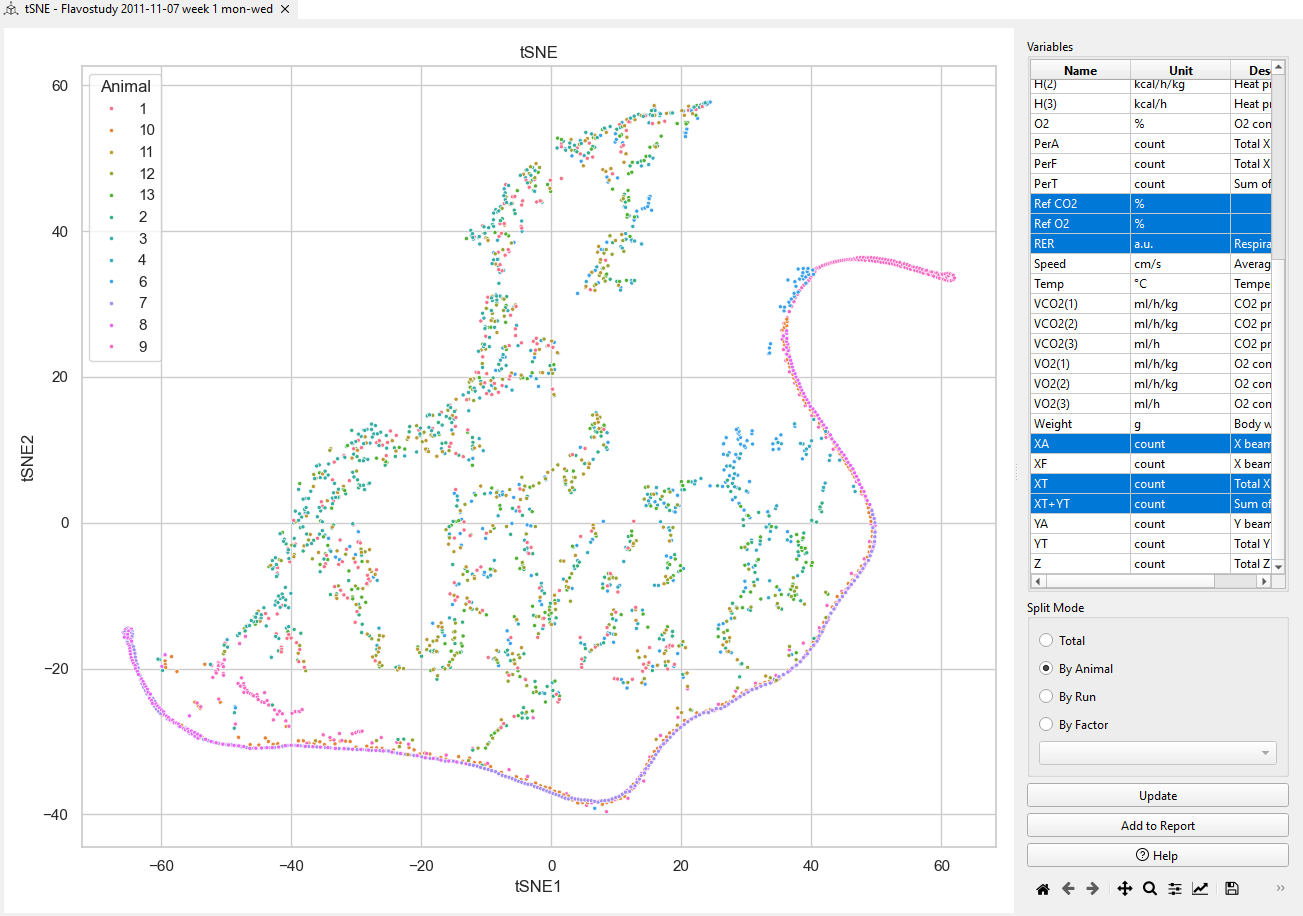
Axis Description : t-SNE1 (X-axis) and t-SNE2 (Y-axis) are the axes of the 2D space created by the t-SNE algorithm, which reduces high-dimensional data into two dimensions for easier visualization.
-
Data Points Each data point represents an individual observation under specific experimental conditions, positioned based on its similarity to other points in the high-dimensional space.
-
Similarity of Data Points Points that are close together on the plot indicate that they are similar in the original high-dimensional data. For example as the figure shown, pink(Animal 8) and purple (Animal 9) points are near each other, suggesting these two animals show similar characteristics or behaviors under the same experimental conditions.The green (Animal 2) and blue (Animal 4) points are far from each other in the plot, indicating that these two animals have different characteristics or behaviors under the experimental conditions.
Note
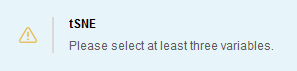
The t-SNE algorithm requires at least three variables to accurately capture the complex relationships and high-dimensional structure of the data. Therefore, the software only supports the selection of at least three or more variables for tSNE analysis.